CMMS Key Performance Indicators (KPIs)
Key performance indicators (KPIs) are business metrics used to evaluate factors that are crucial to the success of an organization. High quality benchmarking leads to a greater understanding of where a company is on the best practices ladder to measure against historical performance, company goals or “world class” metrics. For maintenance professionals, establishing, benchmarking and monitoring KPIs within a modern Computerized Maintenance Management Software (CMMS) solution can mean the difference between exceeding overall corporate business goals and falling short.
Identify Maintenance Needs and ‘Measure What You Treasure’
There are a few different categories of maintenance key performance indicators, including leading and lagging indicators. Leading indicators, which signal future events, include metrics such as PM Compliance, or Estimate vs. Actual Performance. Lagging indicators follow events, and include maintenance metrics such as Mean Time Between Failure (MTBF) and Mean Time to Repair (MTTR). The most comprehensive CMMS KPI tracking includes a mix of both leading and lagging indicators.
By tracking maintenance KPIs and turning this data into meaningful reports and dashboards, organizations can gain quantitative (an organization’s performance compared to goals) and qualitative ( best practices of others currently performing in the “world class maintenance” category) insight.
Tracking this data indicates open opportunities for improvement, and develops baselines for determining how well your organization and your CMMS support best practices. As the saying goes, “Measure What You Treasure.” Identify and prioritize your business goals, such as:
- Reducing Costs
- Reducing Failures
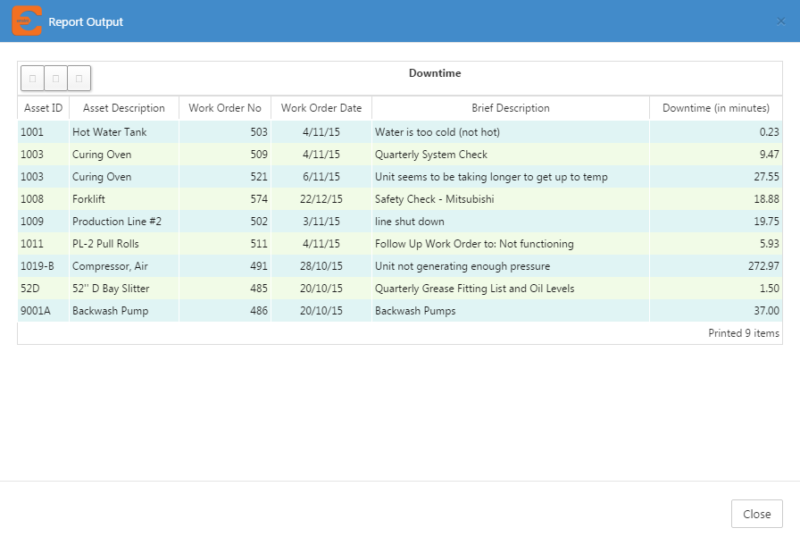
- Reducing Downtime
- Increasing Work Identification
- Increasing Work Planning
- More Effective Work Scheduling
- More Effective Work Execution
Examples of Important KPI Metrics to Benchmark & Track
Many eMaint clients have established, benchmarked and monitored these common maintenance KPIs and experienced visible improvement in:
- Maintenance Backlog
- Mean Time To Repair (MTTR)
- Mean Time Between Failures (MTBF)
- Overall Equipment Effectiveness (OEE)
- PM Compliance
- Planned Maintenance Percentage
Maintenance Backlog
Maintenance backlog is an accumulation of maintenance work that needs to be dealt with based on safety issues, or to prevent further asset breakdowns. The longer work is not completed, the greater the risk of more serious and costly failures.
The goal is to control backlog during normal operations and in emergency situations. One issue organizations can face when neglecting to track this KPI metric could be lack of visibility into backlog, which can result in staffing challenges, firefighting and lack of work prioritization.
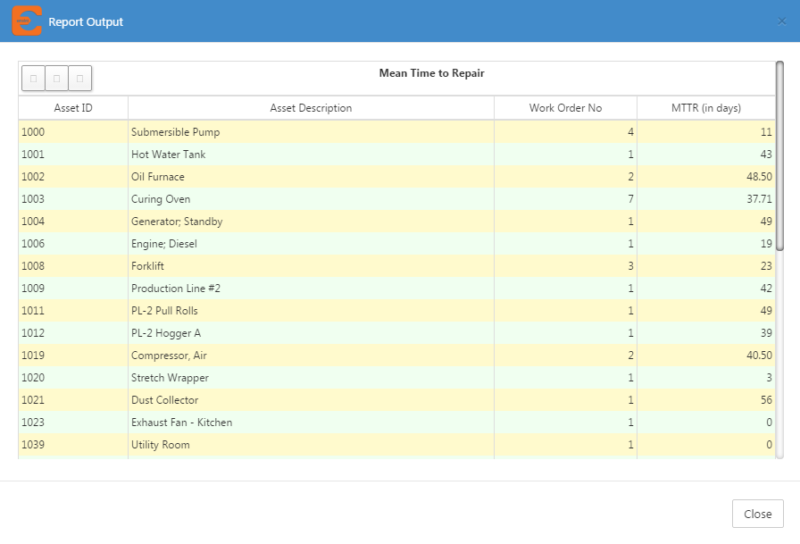
Mean Time To Repair (MTTR)
Mean Time To Repair is a basic measure of the maintainability of repairable items. It represents how long a piece of equipment is out of production, or the average time required to repair a failed component or device.
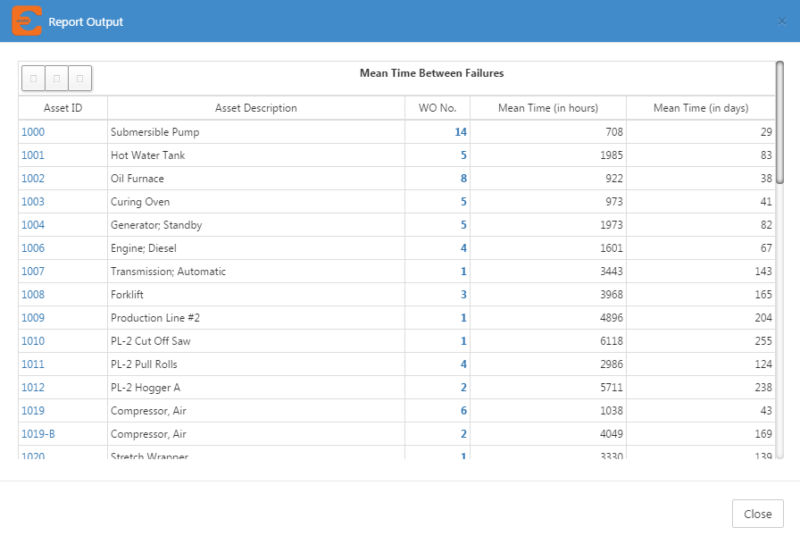
Mean Time Between Failures (MTBF)
Mean Time Between Failures is the elapsed time between failures of a system during operation. For critical pieces of equipment, MTBF is an important way to discern the performance of an asset.
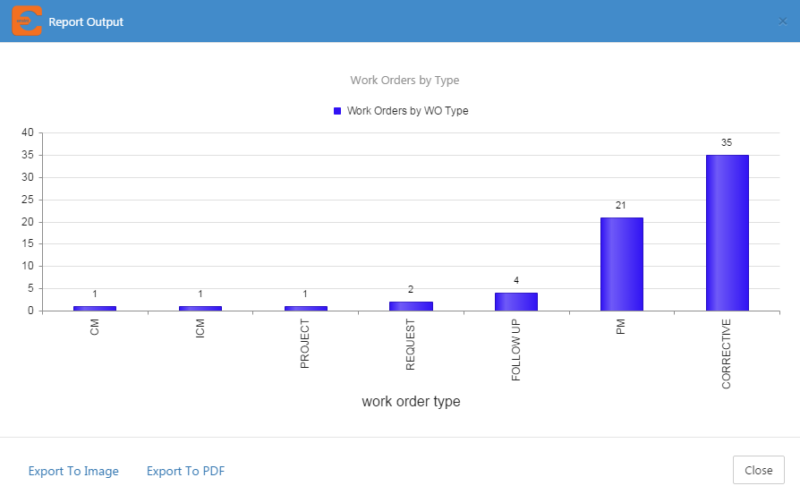
Number of Failures
Overall Equipment Effectiveness (OEE)
Overall Equipment Effectiveness evaluates how effectively a piece of equipment is utilized. OEE calculation is based on the three OEE Factors:
- Availability = Run Time / Planned Production Time
- Performance = (Ideal Cycle Time × Total Count) / Run Time
- Quality = Good Count / Total Count
To discover the total OEE for a particular piece of equipment:
Preventive Maintenance (PM) Compliance
Preventive Maintenance is work that is performed on a piece of equipment on a predetermined schedule, based on elapsed time or usage to lessen the likelihood of it failing. Preventive maintenance is performed while the equipment is still operational, so that it does not break down unexpectedly. PM Compliance is the percentage of scheduled preventive work orders that are completed in a predetermined time period.
A good rule of thumb for PM Compliance is the 10% rule. This means that PM tasks should be completed within 10% of the scheduled maintenance interval. Monthly PMs (every 30 days) should be completed within 3 days of the due date. These measurements in conjunction with unplanned breakdowns can give organizations a more nuanced understanding whether or not a PM program is effective. Organizations can also create reports based on compliance to offer data-driven proof of this effectiveness, or to create accountability and a line of sight into the issues impacting your maintenance program.
Planned Maintenance Percentage
Planned Maintenance Percentage is the percentage of maintenance hours spent on planned maintenance activities versus unplanned. This percentage can be found by dividing the scheduled maintenance labor hours into the total maintenance hours during a particular time period.
World class maintenance notes that 90% of maintenance should be planned. An 80% planned to 20% unplanned ratio is considered still beneficial, compared to the typical average of 55% or less. Planned Maintenance Percentages can be easily tracked with an effective CMMS.
KPI Metrics and eMaint CMMS
Within eMaint CMMS, organizations can set measure KPIs ranging from the productivity of an individual to the overall performance against budget across an entire department.
XTO Energy, a producer of natural gas in the United States, was looking for a CMMS because their former hand-written system resulted in misplaced or unattended work requests. With eMaint, the company saw an increase from 70% to 100% in work completion rates with no additional staffing, and visibility into work backlog at all times.
Klein Plastics produces plastic products for manufacturers and major suppliers of automotive parts, appliances, hand tools, and office furniture. After implementing eMaint, Klein Plastics saw benefits of the system including a 20% increase in overall Equipment Effectiveness, and an improvement in consistency, communication and productivity.
Those are just a few instances of the ability to leverage eMaint’s work management and reporting tools to monitor and benchmark maintenance KPIs, with hundreds of diverse possibilities.